Automated Pore Measurements From Petrographic Images
This article shows the application of image segmentation and blob analysis in order to calculate the pore size distributions and pore parameters of sedimentary rocks from a thin section image.
Background
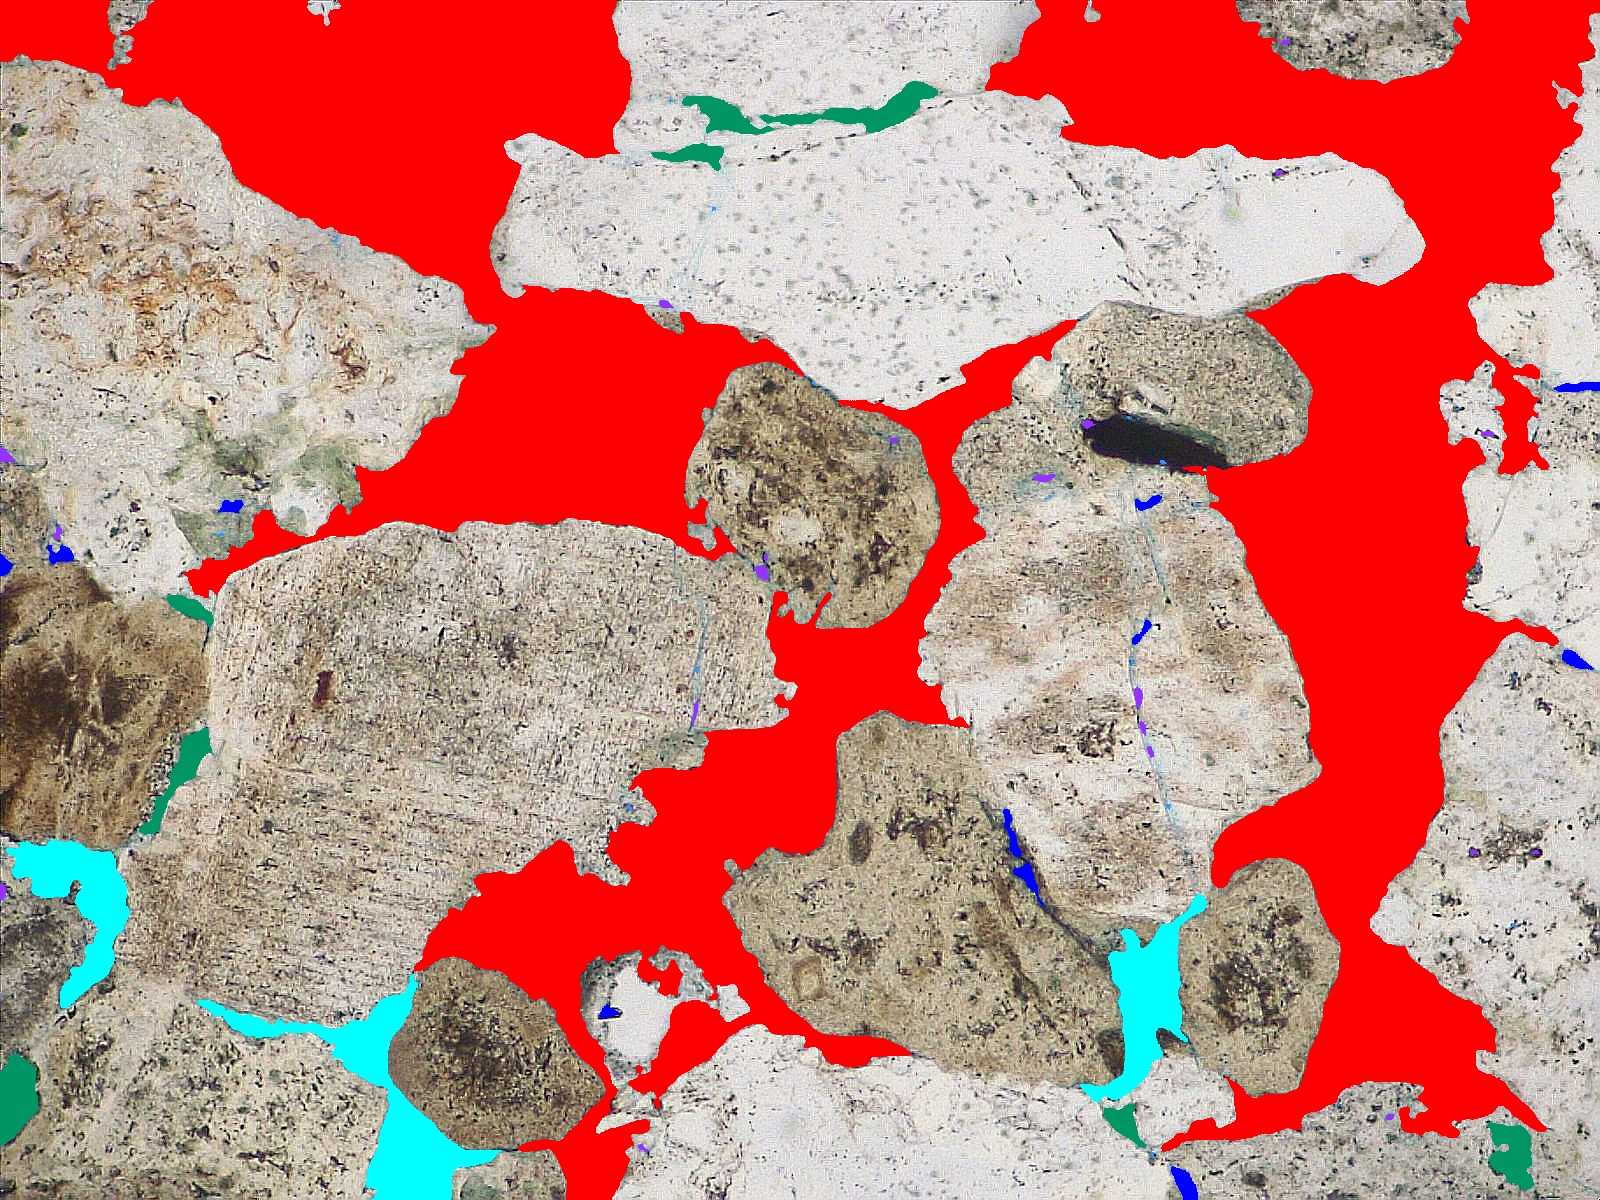
Petrographic image analysis is very useful to extract many parameters of both grains and pores in a sedimentary rock. Images are obtained from a thin section of the rock (tipically 30 microns) in a transmited light microscope. In these thin sections, pores are filled with an epoxy resin with blue dye, so that pores have a very distinct colour that is not confused with any mineral on the rock.
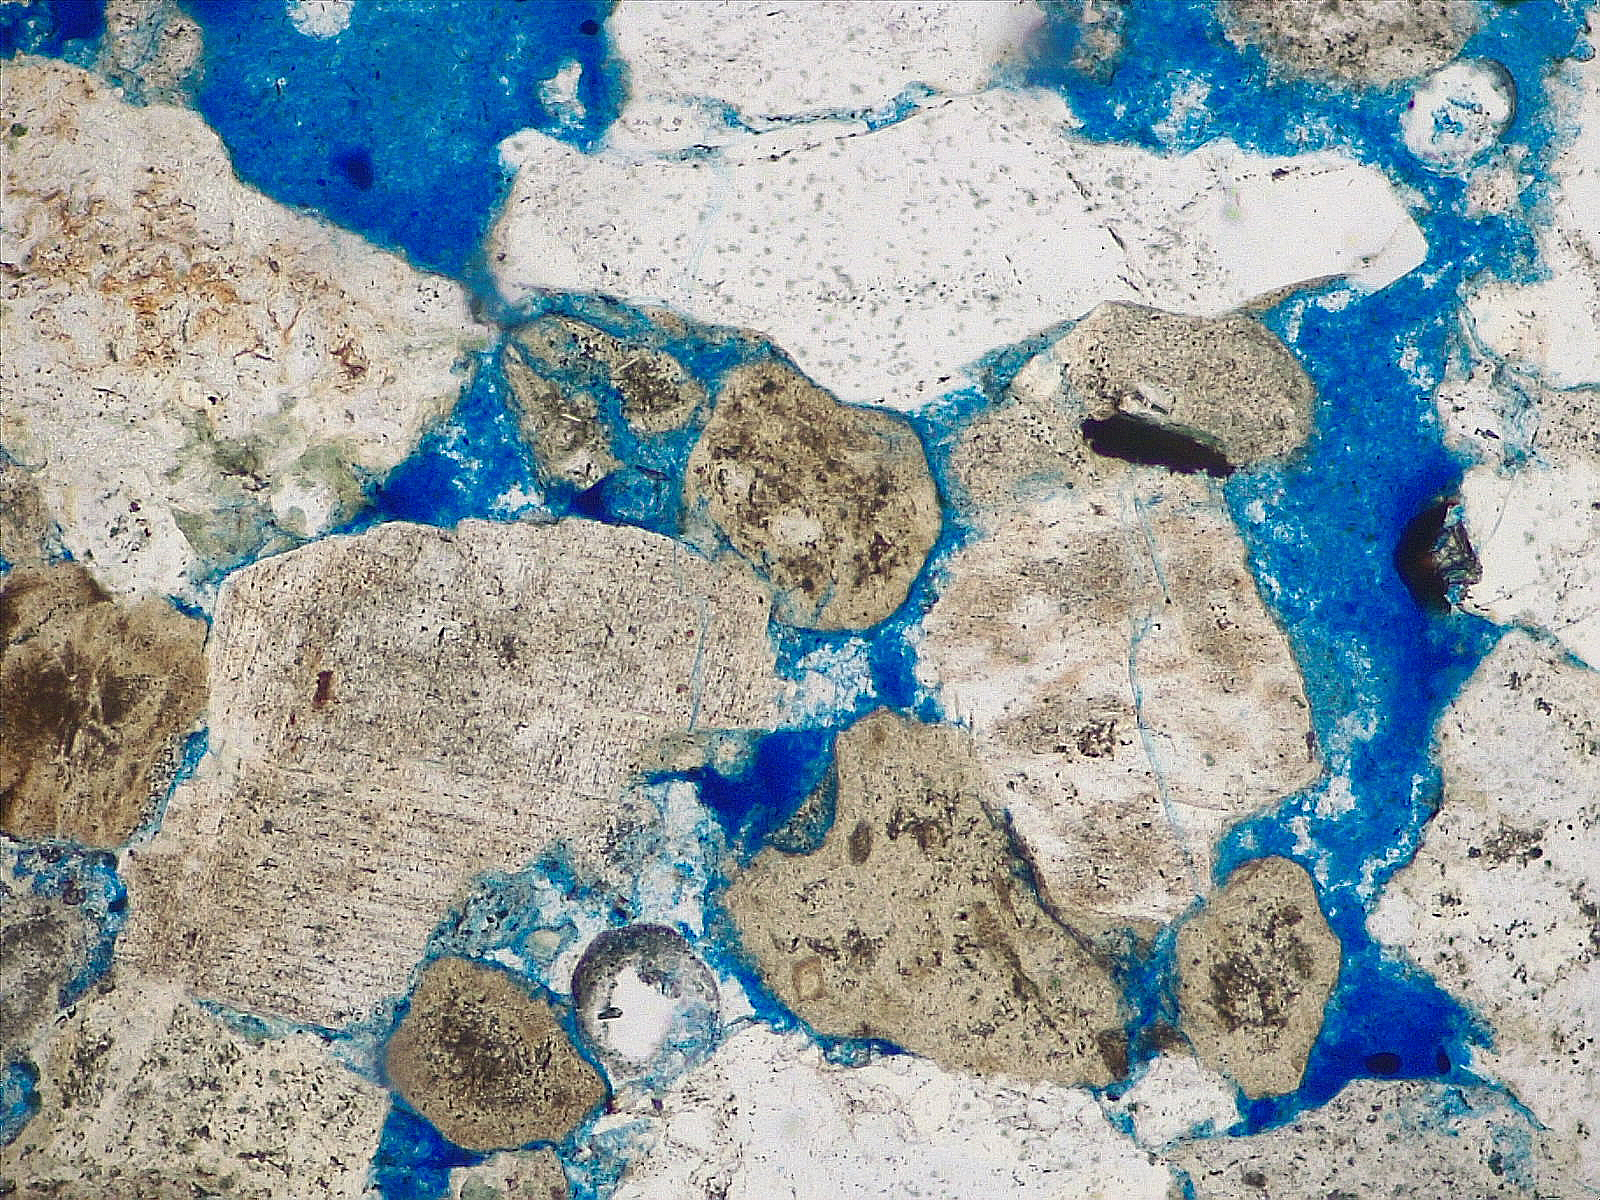 With the image you can extract pores (using a technique called thresholding) and then calculate the pore size distribution with softwares like JMicroVision (https://jmicrovision.github.io/). Total porosity and Pore size distribution is a key element that geologists include in a typical petrographic analysis report. But the process of selecting the blue colour thresholds, and setting the distribution bin limits was somewhat slow (around 10 minutes). In this particular project the objective was to automate the mentioned process to reduce the time a geologist employs to get the total porosity and pore size distribution, because when processing many samples, this reduction can be significant.